Oceanwise Logo
LinkedIn Logo Twitter Logo
Log into Port-Log.net
Contact Page
+44 (0) 1420 768262
    • Home
    • About
      • About Us
      • News & Views
      • Events
      • Newsletters
      • Partners
      • Customer Case Studies
      • Professional Bodies
      • Our Team
      • Our Sustainability and Environmental Goals
      • Careers
      • Contact Us
    • Sectors
      • Overview
      • Ports and Harbours
      • Maritime Pilotage
      • Offshore Renewables
      • Governments and Agencies
      • Customer Case Studies
      • Data as Infrastructure
    • Compliance
      • Compliance Overview
      • Marine Data Management
      • Asset Management System (AMS)
      • Aids to Navigation Management System
      • Conservancy Management
      • Spatial Data Management & GIS
      • Environmental Monitoring
      • Our Courses
    • Monitoring
      • Overview
      • Monitoring System Builder
      • Data Management and Display
      • Port-Log
      • Consultancy and Advice
      • Design and Integration
      • Installation and Maintenance
      • Environmental Conditions
    • Mapping
      • Overview
      • Marine Themes Vector
      • Marine Themes DEM
      • ENC Web Map Service
      • Raster Charts
      • Mapping Support
    • Training
      • Our Courses
      • Data Management
      • Data Management for Ports
      • Data Management, Governance and MEDIN toolset
      • Introduction to Change Management
      • Capacity Building
      • Technical Training
      • Product Training
      • Our Workshops
    • Partners
      • Overview
      • Become a Partner
      • Find a Partner
      • The OceanWise Resource Hub
    • Support
      • Resources
      • Portal
      • Support
      • Glossary of Terms
      • Contact Us
      • Terms and Conditions
banner
We are marine data experts supporting safer, smarter planning and management of marine operations

We are marine data experts supporting safer, smarter planning and management of marine operations

Enjoy the confidence of working with marine data experts

Learn More

Marine mapping data that is fit for purpose, in the right format, accurate and up to date

Marine mapping data that is fit for purpose, in the right format, accurate and up to date

Intelligent marine and coastal mapping data

Learn More

Simplify your approach and improve decision making and data management

Simplify your approach and improve decision making and data management

Tools to manage data and assets, provide spatial awareness, and streamline processes

Learn More

Capture, manage and share critical weather, tide and environmental data to inform decisions

Capture, manage and share critical weather, tide and environmental data to inform decisions

Complete monitoring systems, from conceptual design to ongoing maintenance and support

Learn More

Supporting Smarter Management of Port Marine Operations

Supporting Smarter Management of Port Marine Operations

Ports and Harbours

We are marine data experts supporting safer, smarter planning and management of marine operations

We are marine data experts supporting safer, smarter planning and management of marine operations

Enjoy the confidence of working with marine data experts

Learn More

Marine mapping data that is fit for purpose, in the right format, accurate and up to date

Marine mapping data that is fit for purpose, in the right format, accurate and up to date

Intelligent marine and coastal mapping data

Learn More

Capture, manage and share critical weather, tide and environmental data to inform decisions

Capture, manage and share critical weather, tide and environmental data to inform decisions

Complete monitoring systems, from conceptual design to ongoing maintenance and support

Learn More

Simplify your approach and improve decision making and data management

Simplify your approach and improve decision making and data management

Tools to manage data and assets, provide spatial awareness, and streamline processes

Learn More

Supporting Smarter Management of Port Marine Operations

Supporting Smarter Management of Port Marine Operations

Ports and Harbours

    To receive a copy of our white paper, 'Developing a Marine Spatial Data Infrastructure', please enter your contact details below and we will send you an electronic copy by return.

    If you would NOT like to receive additional marketing communications from us that we feel are relevant to your organisation then please tick the relevant boxes below:

    OceanWise collects and processes your data according to our privacy notice. You can unsubscribe or change your preferences at any time by using the preferences link or opt-out option that will appear in every email we send to you, or by emailing us at info@oceanwise.eu.

Glossary of Terms

OceanWise > Glossary of Terms
A quick reference guide to some of the terms used

Wondering what we mean by Data Management? Do you know what the term MSDI means? Please find below a short glossary of the terms used on our website. If you spot any not included here and you’d like us to add it – please email us at info@oceanwise.eu.

For terminology and references for our mapping products please visit our Mapping Feature Catalogue.

What is Data Management?
Data Management is the development, execution and supervision of plans, policies, programmes and practices that control, protect, deliver and enhance the value of data and information assets. Data is now widely considered to be the second most valuable asset an organisation possesses after its employees. With data volumes multiplying every few months, it is critically important that organisations value and manage his asset through its life-cycle including its collection, quality assurance, quality, ingestion, curation, archiving and use.
Resource links:
Dama (The Global Data Management Community)
MEDIN (Marine Environmental Data and Information Network)

Want to know more? Why not download our white paper “Why Data Management Matters to Ports and Harbours” or see our press article.

What is Data Governance and why do we need it?

Data Governance is the execution and enforcement of authority over the management of data and data-related resources.

See the interesting article on this subject here by Nicola Askham (an Independent Data Governance Coach).

What is a Marine Spatial Data (or Marine Information) Infrastructure or ‘MSDI’?

A Spatial Data Infrastructure is the relevant base collection of technologies, policies and institutional arrangements that facilitate the availability of and access to spatial and business data. It covers the processes that integrate technologies, policies, standards, and people; the structure of working practices and relationships across data producers and users for access, sharing and analysing geospatial information across government and commerce. It also includes hardware, software and system components necessary to support the processes. Importantly, an SDI is not a central repository for data, a portal for discovery, view and download of data nor simply GIS software.

A Marine Spatial Data Infrastructure encompasses all marine and / or maritime information including maritime boundaries and limits, conservation areas and marine habitats, oceanography, bathymetry, geology, wrecks, offshore installations, pipelines and cables.

Please download our MSDI white paper or see our press article here.

What is a Maritime Information Infrastructure (MII)?
A Maritime Information Infrastructure (MII) is based on good data management principles and applies lean process management from manufacturing to the flow of information through the port. It is built on the “four cornerstones” of a Spatial Data Infrastructure (see above) and applies these at the enterprise level. It involves engaging and educating port personnel and contractors (people), applying open system and technical standards, utilising existing, or where required, improving ICT infrastructure, introducing registries and metadata, and strengthening data. See our full press article here on “Delivering a Maritime Information Infrastructure to Ports” and MII diagram.
What is an ENC?
ENC stands for ‘Electronic Navigational Chart’.
If you require ENC’s, OceanWise can provide several options. We offer: an ENC Web Map Service, software that allows you to produce your owns ENCs or if you don’t have access to a GIS, we can create ENC’s for your specific needs. Please click here.

What is Telemetry?
Telemetry is the process of recording and transmitting the readings of an instrument OR “the mechanism of getting data from where its collected to where it is needed”. OceanWise specialises in marine telemetry handling the process of recording and transmitting the readings of marine sensors and equipment such as weather and tidal data, so that it can be viewed, used and disseminated by those who need it (for example VTS teams, Pilots, Dredgers, Hydrographers etc).
What is ‘Smart’ Telemetry?
We use the term ‘Smart Telemetry’ to describe our specially developed modems (rt.buffer and ip.buffer) which are deemed as “smart” because of their extra attributes which are: configurable, swift, intelligent, compact, flexible, robust, secure, remotely managed, power & cost efficient. Download our brochure here.
What is the UN-MGIWG?
The UN-MGIWG stands for the UN Marine Geospatial Information Working Group. See our full press article here.
What is the UN-GGIM?
The UN Marine Geospatial Information Working Group (UN-GGIM). See our full press article here. Please also see the article in GIS Professional June 2019 on the difference between OGC, GEO and UN-GGIM & “Driving the Global Geospatial Agenda”
What is the XL in Raster Charts XL and why have we eXcluded Land from Raster Charts?
The XL stands for eXcluding Land
Land mapping datasets tend to fill bodies of water with a shade of blue, because maritime information isn’t useful for the majority of their users. In the same vein, Nautical Charts fill land with a mustard shade. These datasets are suitable for someone navigating a car, or a ship, but what happens when your use case requires harmonised land and maritime information? RCXL is developed to solve this exact issue.
By removing the land from Nautical Charts, users are now able to combine the useful aspects of both datasets for a harmonious mapping experience across land and sea. Finally, as Nautical Charts are designed without any context of the surrounding charts, land from one chart will often overlap valid maritime data from another – a by-product of removing the land is that issue is also resolved in RCXL.
What is the difference between a Raster Chart and a Vector Chart like Marine Themes Vector?

Our mapping data is available in digital form as either a Raster Chart in Geotiff format or in various GIS friendly vector formats e.g. GML, SHP, FGDB.
Raster Charts are simply digital images of standard nautical paper charts. This means that they only show the information available on the paper chart. Each pixel in the image represents a colour value so there is no intelligence in the raster image. Raster charts are created by scanning the paper chart.

Marine Themes Vector is an intelligent dataset. It is coded with additional information not available in paper or raster charts. It carries a wealth of geo-spatial data and is linked to a database of associated information. The user can click on different features, such as a shipwreck or buoy, and retrieve additional information about that specific feature. For example, a wreck appears only as an symbol on an raster chart, but in the vector data a user can click on the feature and see the additional information, such as depth, date sunk and cargo. Marine Themes Vector also provides the user with control over how the chart is displayed, so you can easily turn different layers of information on and off leaving you with a tailored map only showing the user the details that they require. Try our range of mapping products out for yourself on our demo page: www.maps.oceanwise.eu Or download our data buying guide here.

What is a Factory Acceptance Test (FAT)?
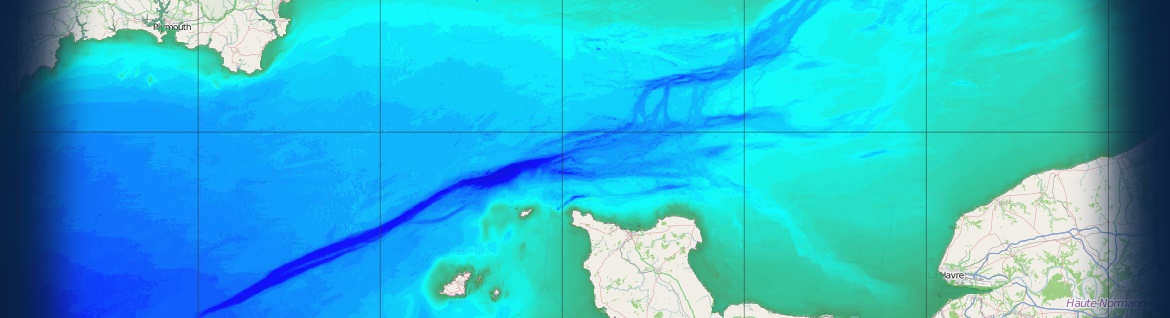
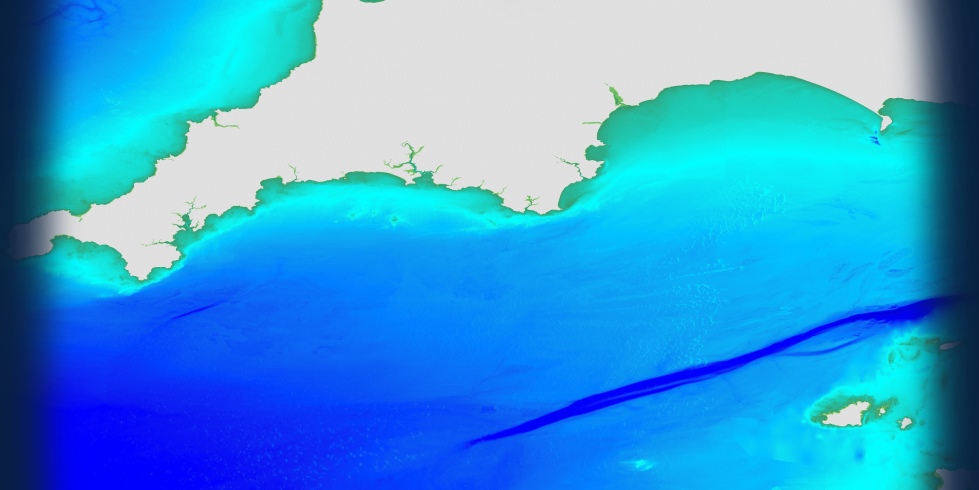
At OceanWise we believe that it is of utmost importance that systems are fully tested and proved fit for purpose. As part of our standard process we invite our customers to attend a FAT – this is where the customer(s) are invited to our workshop to observe the system working as specified. A User Acceptance Test (UAT) is the same but usually undertaken post deployment, on site with the end users, again the purpose of this is to prove that the system is working as specified.
What is Bathymetry?
Bathymetry is the study of mapping the seafloor. See Hydro International’s September 2019 article on what bathymetry is here.
What is a Digital Elevation Model?
A Digital Elevation Model is a representation of the Earth’s surface. It is a grid of squares where each square represents the height/depth at that location. Our Marine Themes Digital Elevation Model represents the depth of water (relative to Chart Datum) so shows the shape of the seabed.
What is Shoal Bias?
Shoal Bias is the practice of taking the shallowest depth in an area to show on a navigational chart to ensure safe navigation. The depths on a navigational chart do not necessarily accurately represent the true form of the seabed. If you are interested in the true form of the seabed, our Marine Themes Digital Elevation Model is derived from high accuracy survey data and does not have shoal bias applied.
What is the difference between a Digital Elevation Model and Elevation data from nautical charts?
A bathymetric chart differs from a hydrographic chart in that accurate presentation of the underwater features is the goal while safe navigation is the requirement for the hydrographic chart. A hydrographic chart will obscure the actual features to present a simplified version to aid mariners in avoiding underwater hazards.
What is a Storm surge?
A Storm surge, as it is known, is caused by a combination of the inverse barometer effect (i.e. sea level rises where there is low pressure and drops where there is high pressure) and wind stress that pushes the water in the direction of the wind (or thereabouts) which then piles up in a leeward basin or on a leeward shore. In enclosed sea areas, bays, harbours etc. resonance also occurs as the water ‘slops’ back and forth. This is known as seiching and the frequency of the ‘slop’ depends on the size, shape and depth of the enclosed area.
What is a Data Web Service?
Web Services were developed by the Open Geospatial Consortium as a way of delivering data over the internet using standard protocols. As they follow defined standards they are easily used within most GIS software.
Web Services come in a variety of ‘flavours’.
A Web Map Service (WMS) delivers data as a raster image back to the user based on the specific request sent to the Server hosting the Service. The request will contain the extents of the image and the layers required. If the data being used to create the image is Vector data then it is possible to enable Querying on a WMS so the end user can click on a feature in the image and get back the attributes of that feature, however it is not possible to use these in analysis.
A Web Map Tile Service (WMTS) is very similar to a WMS but the data is cached in Tiles at various Zoom Levels on the Server.The request would contain the extents and the zoom level needed and all Tiles intersecting this will be returned. These are often much faster than a WMS as the images returned to the end user system are pre-built.
A Web Feature Service (WFS) delivers data as a vector dataset so can be used for analysis. Features are clickable and queryable just like using a regular vector dataset in GIS.
How can I use a Data Web Service?
Off the shelf GIS software can nearly all now display OGC Web Services. Each GIS will have its own specific steps to connect so please refer to your software’s user guide. The only requirement is an internet connection will be required anytime you want to access the Service.
To connect to a Data Web Service you will need a URL of where the data is stored plus username and password if the Service is protected (all OceanWise Web Services require login details). Once connected you can use the Data Service just like any locally stored data layer.
In addition the Data Service can be added to online web mapping applications. Each application will have its own steps to add so please refer to the applications user instructions.
Why use a Data Web Service?
OceanWise Web Services take the headache out of managing your data holdings. We update all our Services as we receive new datasets so you don’t need to. You no longer need to download updates and make sure your holdings are correct, you just access the URL and it will all be done for you.
This does require an internet connection at all times the data is to be accessed. If you have users who may need access to the Data but wouldn’t have access to an internet connection (e.g. out in the field) then you would still require Datasets.
To see examples of our Data Web Services please click here
What is GIS?
A geographic information system (GIS) is a software programme which helps gather, manage and analyse data. It can be open source like QGIS or a proprietary programme such as ESRI or Cadcorp. GIS integrates many types of data and analyses spatial location (everything happens somewhere) and organizes the layers of information collected into visualizations using maps.
Why is GIS important for marine professionals?
Everything a marine professional does is somewhere – so can be placed on a map. A map (aka picture) is easier to understand by a greater number of people than a table or list of information. It provides context and shows relationships between seemingly disparate datasets. The tools within a GIS allow analysis of data so the data can be turned into information to provide evidence based decisions.
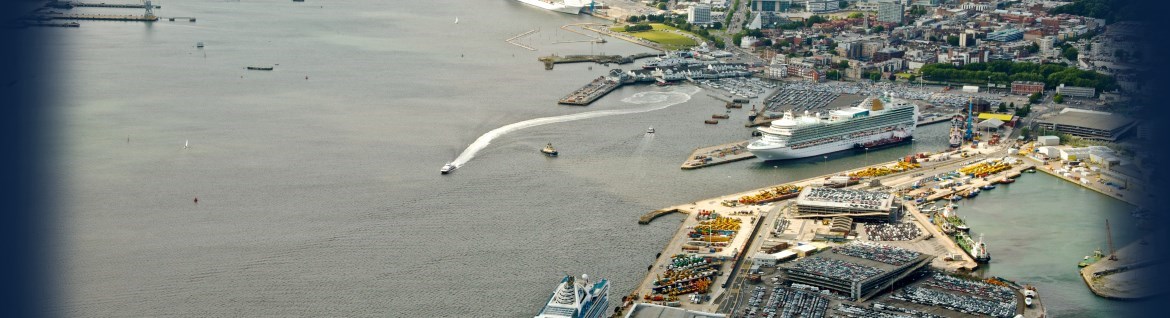
Why is GIS particularly important for Ports?
Many don’t realise the Vessel Traffic System (VTS) within a Port is a simple GIS for a specific purpose – it displays a map with different features on it (aids to navigation, berths, vessels), the user can click on a vessel and find out more information about it (attributes).
Everything a port does or owns has a location so can be placed on a map. A map (aka picture) is easier to understand by a greater number of people than a table or list of information. It provides context and shows relationships between seemingly disparate datasets. The tools within a GIS allow analysis of data so the data can be turned into information to provide evidence based decisions

Learn More

  • Monitoring Overview
  • Our Customers
  • Our Workshops
  • About Us

International Hydrographic Organisation

The work that OceanWise does in data management epitomises the way in which the hydrographic community should be moving in the twenty first century.

Robert Ward - President

Why OceanWise?

We are proud to be: Independent. Experienced. Innovative. International. Trusted.

ISO 9001ISO 14001ISO 45001cyberessentials certification

© OceanWise 2023. OceanWise Limited is an independent company specialising in marine environmental data acquisition, management, publishing and GIS.
Registrar of Companies of England and Wales No. 7206926 and Companies Registration Office Ireland No. 641571.

Terms & Conditions | Privacy Notice | Contact Us

OceanWise HelpBot

Still need help?